1. Abstract
A journey from Hell to Heaven, investigating the computational opportunities of automating text analysis and producing data visualisations.
This poster presents the results of the exploratory work for a reusable tool to generate data visualisations based on automatic text analysis.2 Its non-functional requirements respond mainly to flexibility (accept different text inputs) and optimisation (produce rich visualisations with minimal set up). The visual outputs produced by the application have an explorative function in that they aim to:
- offer a different perspective on the text under study;
- highlight patterns and/or outliers (Meirelles 2013);
- drive research in formulating new hypotheses;
- provide support to, or disprove, existing theses.
The current version accounts for modules (i.e. software components) designed around one selected test case, namely Dante Alighieri’s Divine Comedy, but serves as a blueprintfor further modules to be plugged in.
The Italian version of the Commedia (Petrocchi 1966-67) is used to perform text structural analysis and work on the rhyme scheme, while the English translation (Mandelbaum 1980-84) is used for sentiment analysis. The unique way in which Dante wrote his masterpiece, makes the text an interesting dataset to be explored computationally. Structural (spatial and temporal) textual components lend themselves to be represented graphically, and offer insights into its linguistic content.
The visual outputs allows users to interact with both the content and the metadata.
The application performs computational text analysis to produce data visualisations representing the following structural, stylistic and semantic features of the text:
- schematic representation of the poem’s structure and rhythm (fig. 1);
- distribution of keywords (fig. 2);
- visual representation of the sentiment analysis (fig. 3).
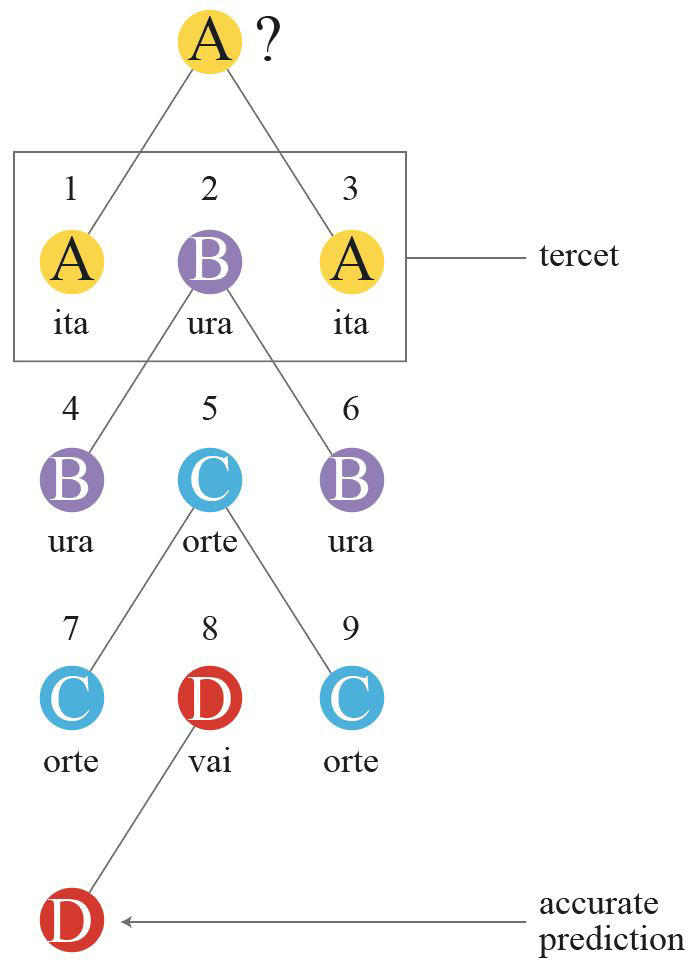 Figure 1 An example of the schematic representation of the poem’s structure: rhythm imposed by tercets and rhyme prediction.
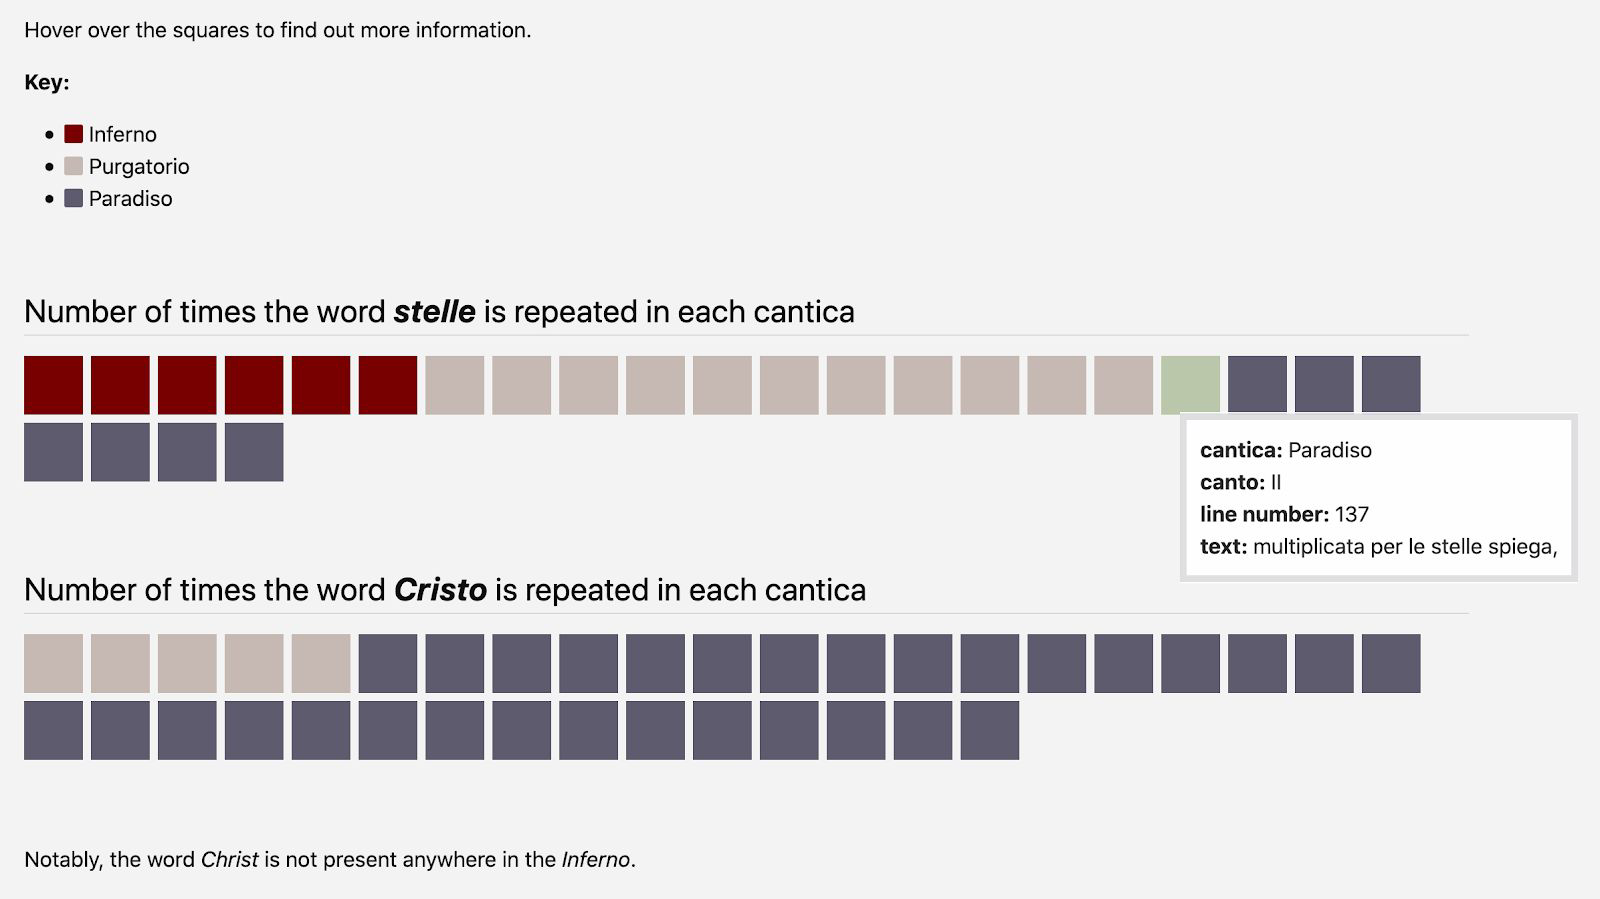 Figure 2 Words like Cristo (Christ) and stelle (stars) are distributed unevenly across the three cantiche: the word “Christ” never appears in the Inferno, while it’s widely used in the Paradiso. One square per line.
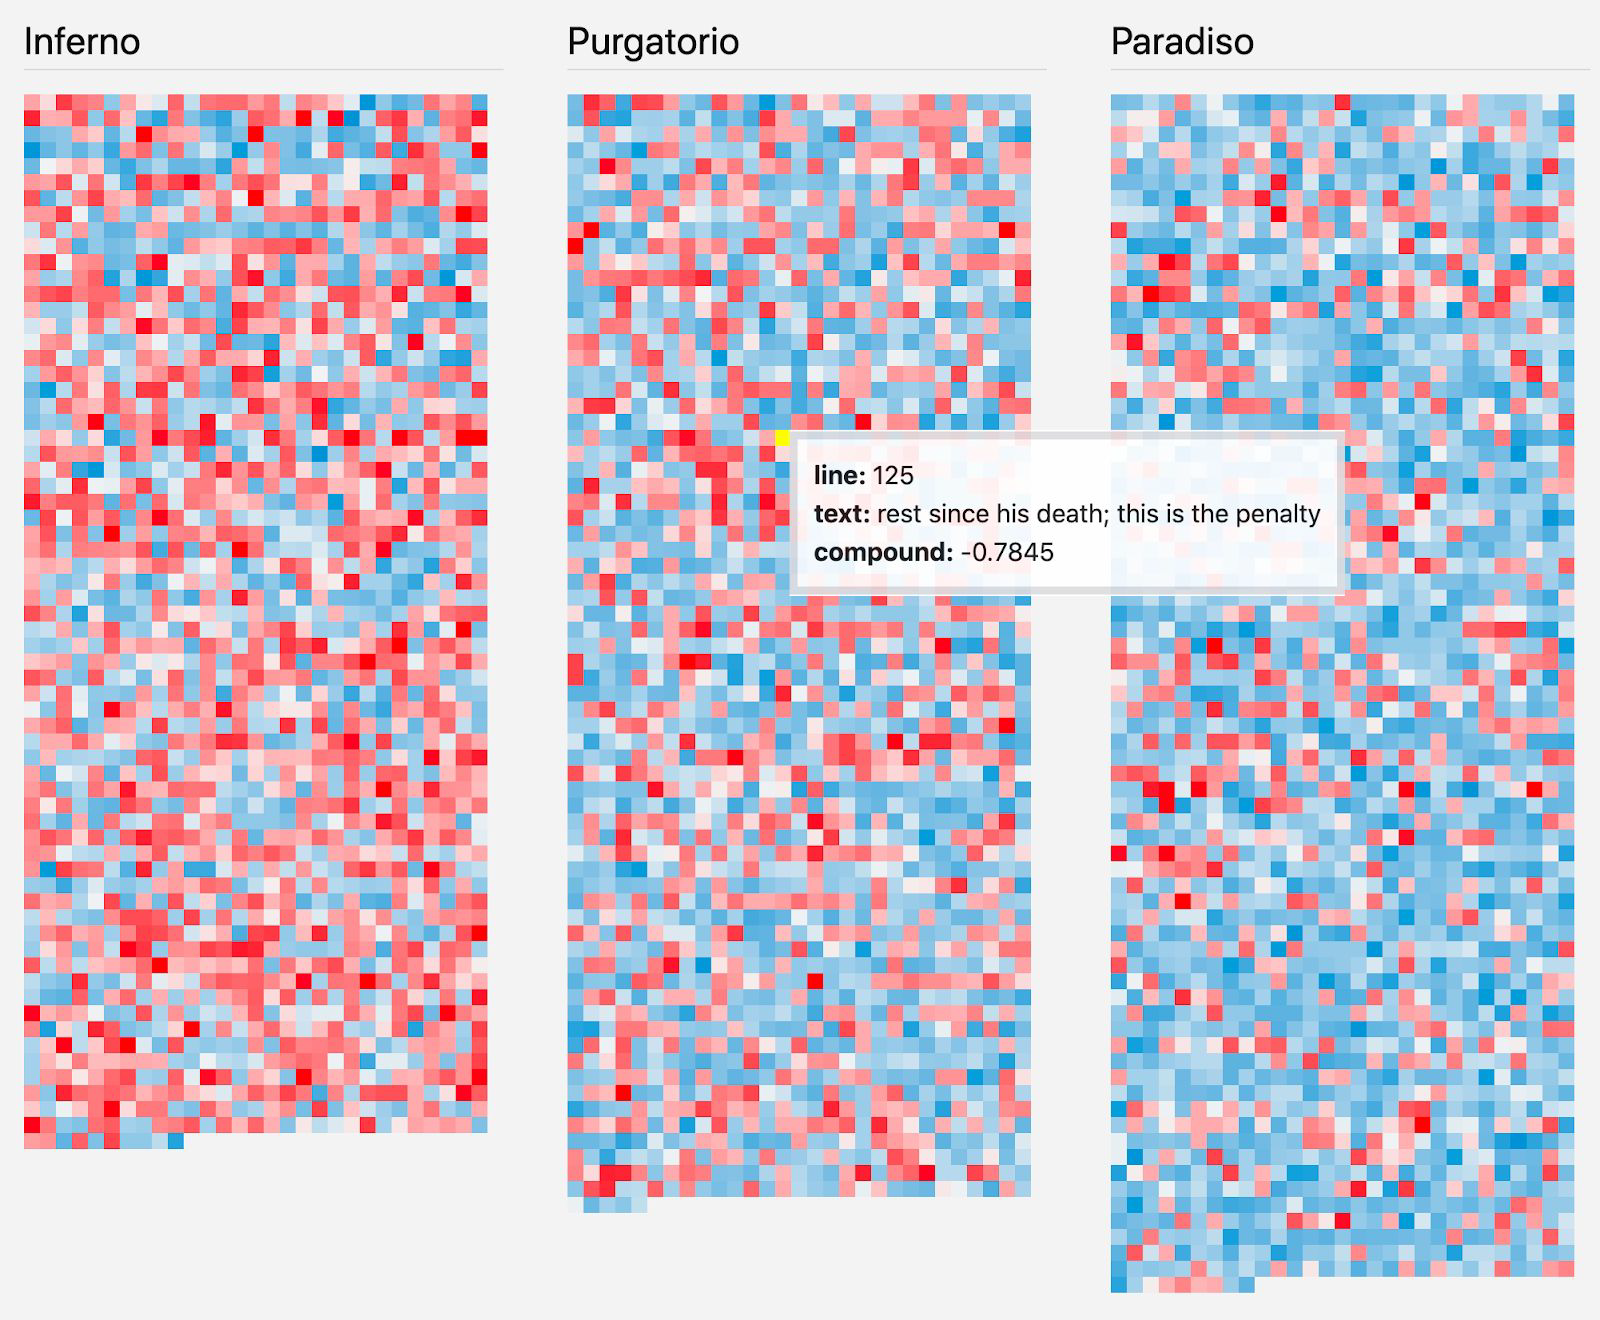 Figure 3 Sentiment analysis visualisation of the three cantiche. Red is negative, blue is positive and the opacity indicates how close to the polarity (-1, 1) the sentiment is. One square per line.
The application has been developed modularly (Martin and Martin 2006), following the separation of concerns design principle (Dijkstra 1982) to allow for flexibility and scalability.
The computational aspect of the project is implemented in Python, a flexible programming language that supports object-oriented programming and functional paradigms.
The visualisations are produced with the support of d3.js library, “a JavaScript library for manipulating documents based on data” (Bostock D3.js
Natural language processing (NLP) and machine learning techniques have been applied to process and transform the data. The Naive Bayes Classifier (Perkins 2010) technique has been chosen due to its performance and simple implementation.
A training dataset has been manually created collecting random subsets of text from other authors close in language and time, and further work from Dante himself:
- Ludovico Ariosto, Orlando furioso (Wikisource contributors 2012)
- Dante Alighieri, Convivio (Gallarino
- Giovanni Boccaccio, Decamerone (Wikisource contributors 2017)
The poster illustrates the workflow from input to output, displaying a diagram of the process.
The poster demonstrates achievements of this proof of concept and development ideas for the future. The main success lies in its modular development (fig. 4), making it amenable to further development3 (algorithm refinements, visualisation workflows, stylometric analysis). More languages and different text structures will be integrated and a wider range of output visualisations offered, while making use of the same core functionalities for ingesting and processing data.
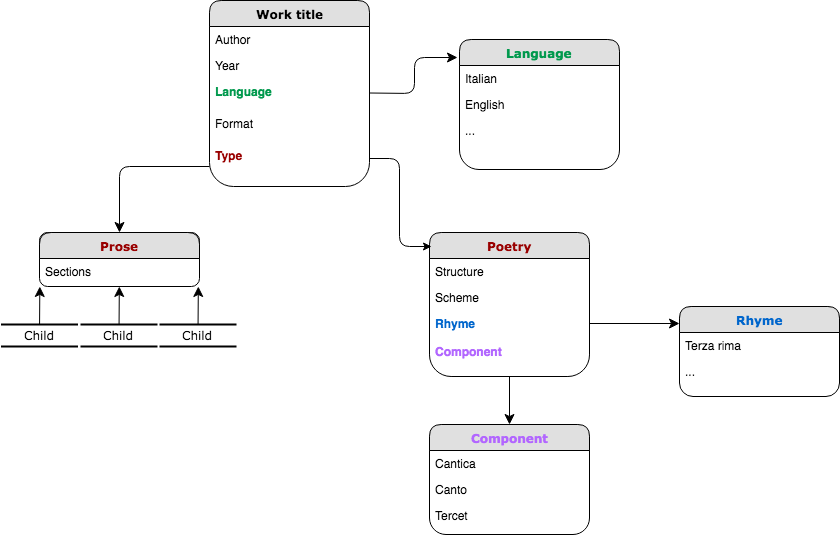 Figure 4 The data model of the application, illustrating the separation of concerns and
the potential for extensibility.
1 Github repository: https://github.com/ginestra/dante-visualised
2 Existing tools such as Voyant Tools (https://voyant-tools.org/), HuViz (https://cwrc.ca/Documentation/HuViz/HuViz_Concept.html), iteal (http://iteal.vizcovery.org/) are either collating a wide range of existing tools, or targeting very specific cases. The aim of the tool presented here is to provide a lightweight, but solid application core that is extensible in the hands of the user, but doesn’t lose its simplicity in use at set up.
3 The project is supported by King’s Digital Lab (KDL) 10% time allocated for personal research, aiming at
further funding for future development in order to guarantee the extension and long term sustainability of
the application.
List of references
- Meirelles I., "Design for Information: An Introduction to the Histories, Theories, and Best Practices Behind Effective Information Visualizations", Rockport Publishers, 2013, p. 189.
- Petrocchi, G. (1966-67). “Dante Alighieri, La Commedia secondo l'antica vulgata, a cura di Giorgio Petrocchi”, Mondadori, Milano.
- Mandelbaum, A. (1980-84). “Divine Comedy of Dante Alighieri”, University of California Press.
- Martin R. C., Martin M., “Agile Principles, Patterns, And Practices in C#”, Prentice Hall, 2006, ch. 8.
- Dijkstra, E. W. (1982). “On the role of scientific thought”. Selected writings on Computing: A Personal Perspective . New York, NY, USA: Springer-Verlag. pp. 60–66. ISBN 0-387-90652-5.
- Bostock, M., D3.js [Accessed 12 September 2019]
- Perkins J., “Text classifier for sentiment analysis - Naive Bayes Classifier”, 10 May 2010,
- Wikisource contributors (2012), “Orlando Furioso/Canto V”, Wikisource,
- Gallarino, M., “Convivio”
- Wikisource contributors (2017), “The Decameron (Rigg)”, Wikisource,