1. Abstract
If network analysis has made its way into the humanities toolbox, and especially in history (Düring et al. 2016), it is because it helps to grasp the complexity of the objects of these disciplines. However, to understand the multidimensionality of the data requires a consequent reflection on its modeling.
This paper seeks to be part of a series of publications aimed at making advanced network analysis concepts more accessible to the humanities scholars: from ontological questions (Langmead et al. 2016) to the necessary discussion of the integration of temporality in graphs (Lemercier 2015; Conroy et al. 2019), the development of typologies of uses (Grandjean 2017a) or attempts to provide aids to interpretation (Grandjean & Jacomy 2019). The question of multilayer networks becomes especially more and more important, whether in a general way (McGee et al. 2016) or applied to the humanities (eg. Vugt 2017; Grandjean 2017b).
Our purpose is to discuss a unifying conceptual framework allowing the transition between a current formal multilayer model (Kivelä et al. 2014; Knudsen et al. 2019) and the language of the humanities. This framework is expressed by a visual representation that contains a multiplicity of layers that synthesizes and clarifies the different possible networks and facilitate the appropriation of the model by researchers.
Description of the framework
The key element of this concept is the distinction between “layers” and “levels”: within a horizontal level, 1-mode graphs all have the same set (and type) of nodes (visualized with a fixed position or not, depending on our will to represent the different structures or to help keeping the “mental map” between each other). A level is therefore a multiplex system of layers. The levels can be connected together by edges that express the relation between two types of nodes (2-mode).
It is to be noted that the formal model does not imply a hierarchy between layers. Here, this verticality is only a visual artifact to facilitate the expression of all kind of humanities datasets. Each level represents one entity type and relationships within. It can have many layers organized by “aspects” and include edges between these layers. The inter-level relations can be represented on a layer that contains a 2-mode network (which can also be deployed according to different aspects).
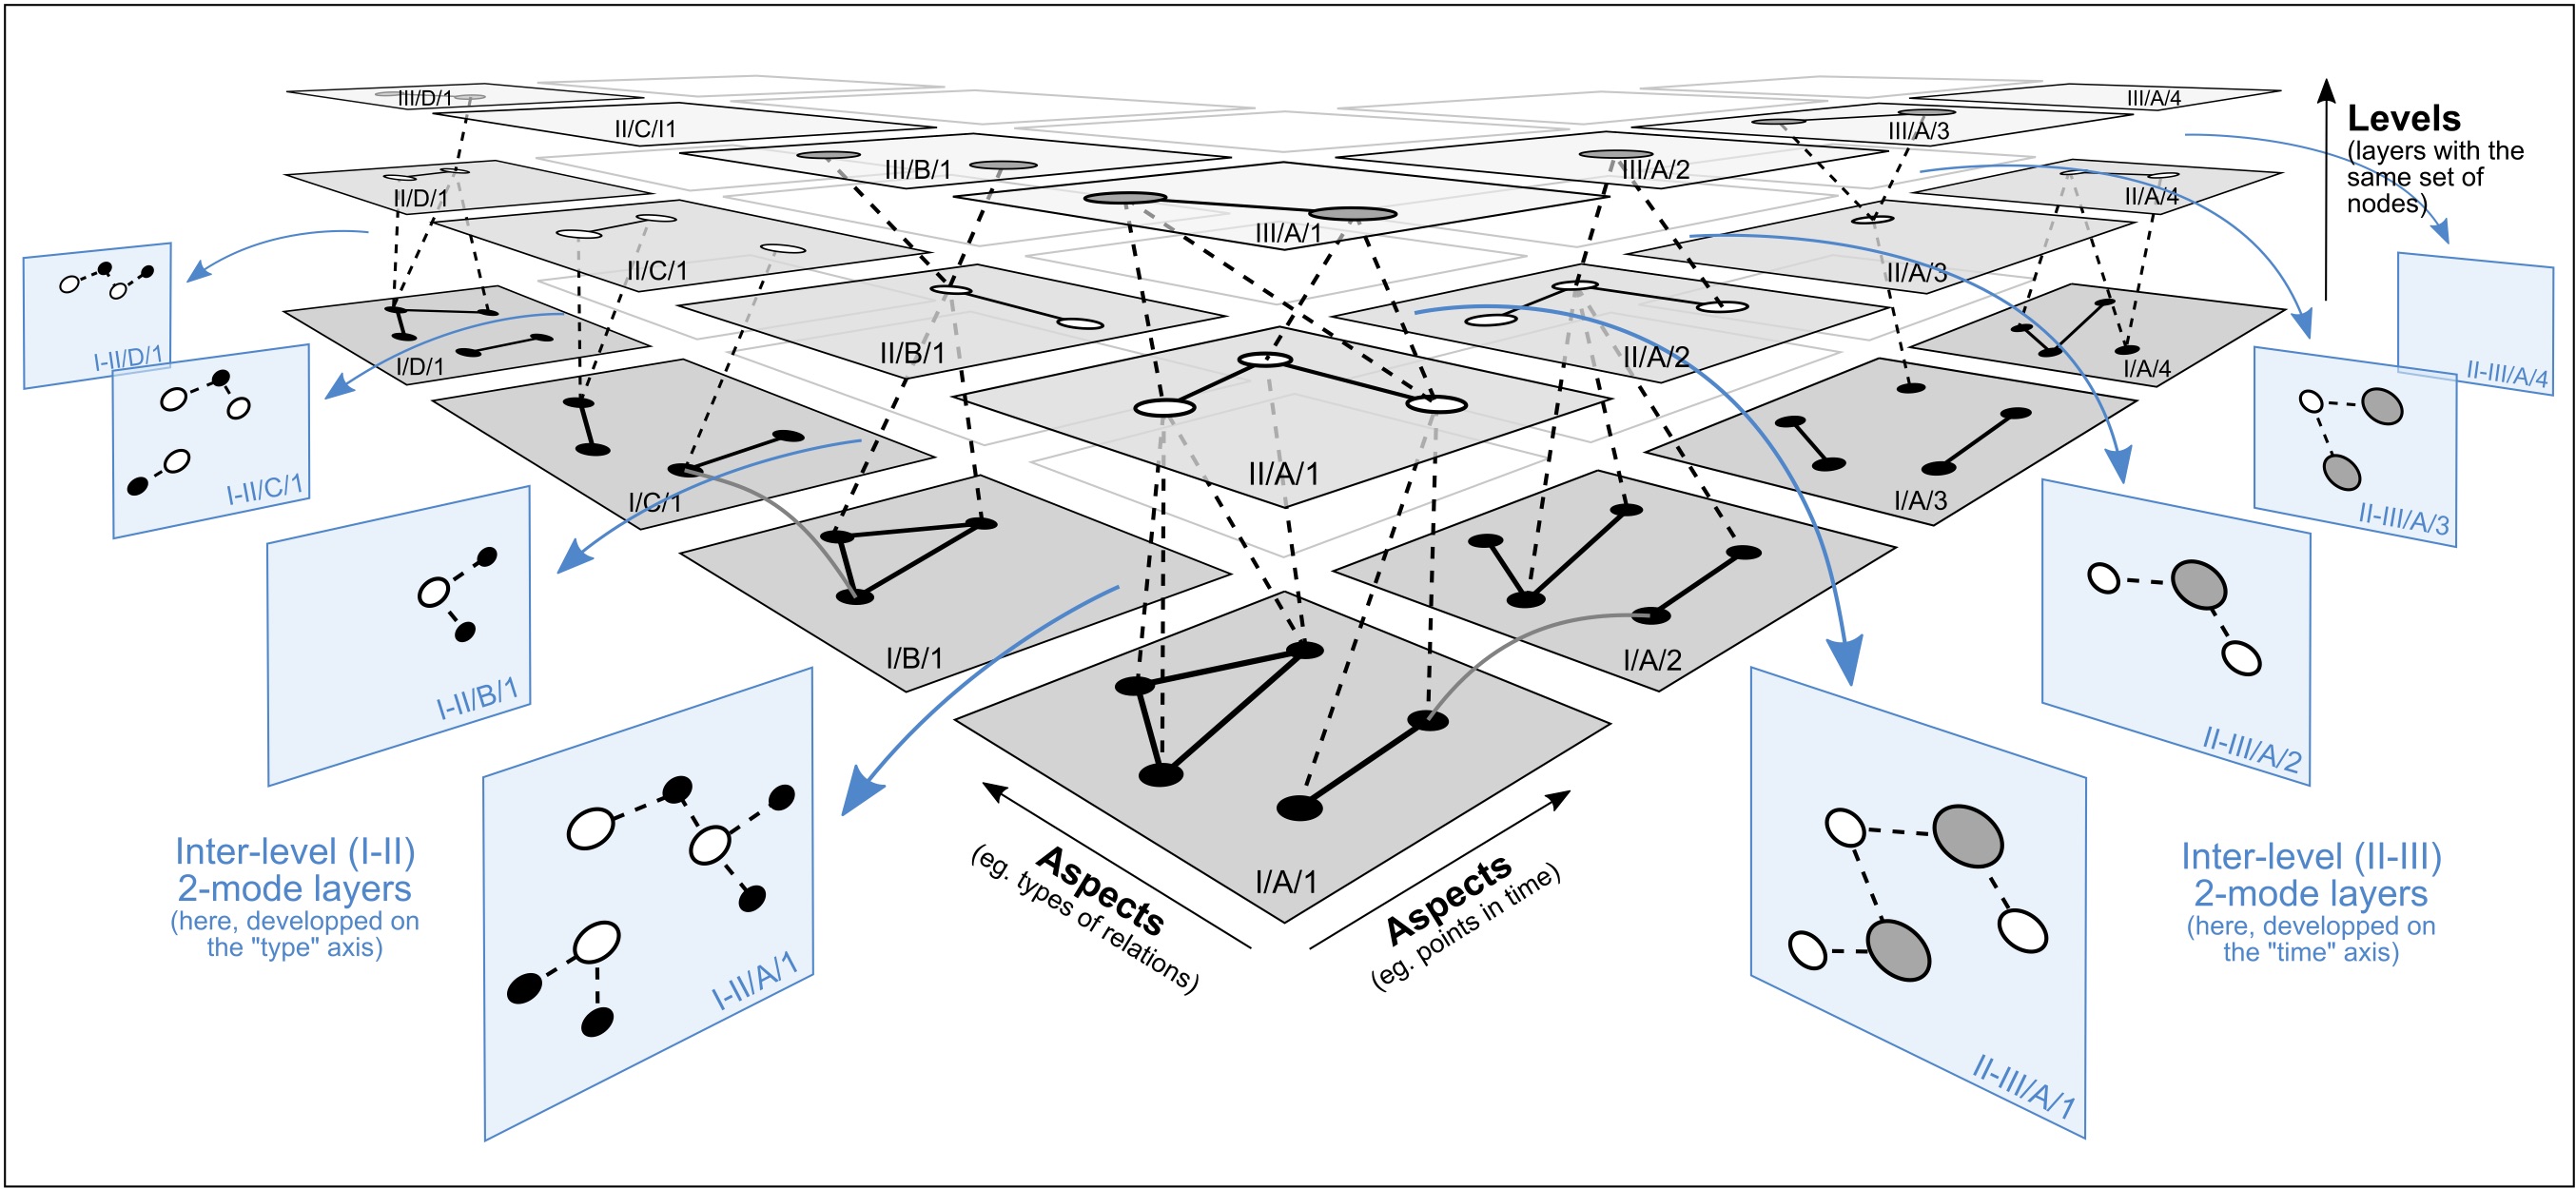
Figure 1: Multilayer network system made of three 1-mode networks organised on three layers set (“levels”) connected by two 2-mode networks. At each level, this representation explicit the possibility of developing the graph depending on (at least) two aspects.
The visual expression of this framework (fig. 1) looks quite similar to an OLAP Graph Cube (Zhao et al. 2011) or a Space-Time Cube Visualization (Bach et al. 2014). The proposed framework is however not a cube: this well aligned appearance is a convenient way of representing things to make them less abstract so that they can be used to discuss modeling issues. Not all levels necessarily have the same dimensions and do not need to be aligned. Moreover, there can be more than three axes since it is an intellectual tool and not a graphic construction.
Use cases
This visual convention allows to design “scenarios” where the model coincides with data from applied research to make the layers within them explicit:
- Affiliation networks (fig. 2.1) based on interlocking data with multiple companies, institutions, prosopographic categories (eg. David & Westerhuis 2014).
Character networks (fig. 2.2) based on theatre plays with addition of information on groups, families, temporality (eg. Xanthos et al. 2016).
Circulation networks (fig. 2.3) with multiple transportation means, places, goods, routes, letters (eg. Orengo & Livarda 2016).
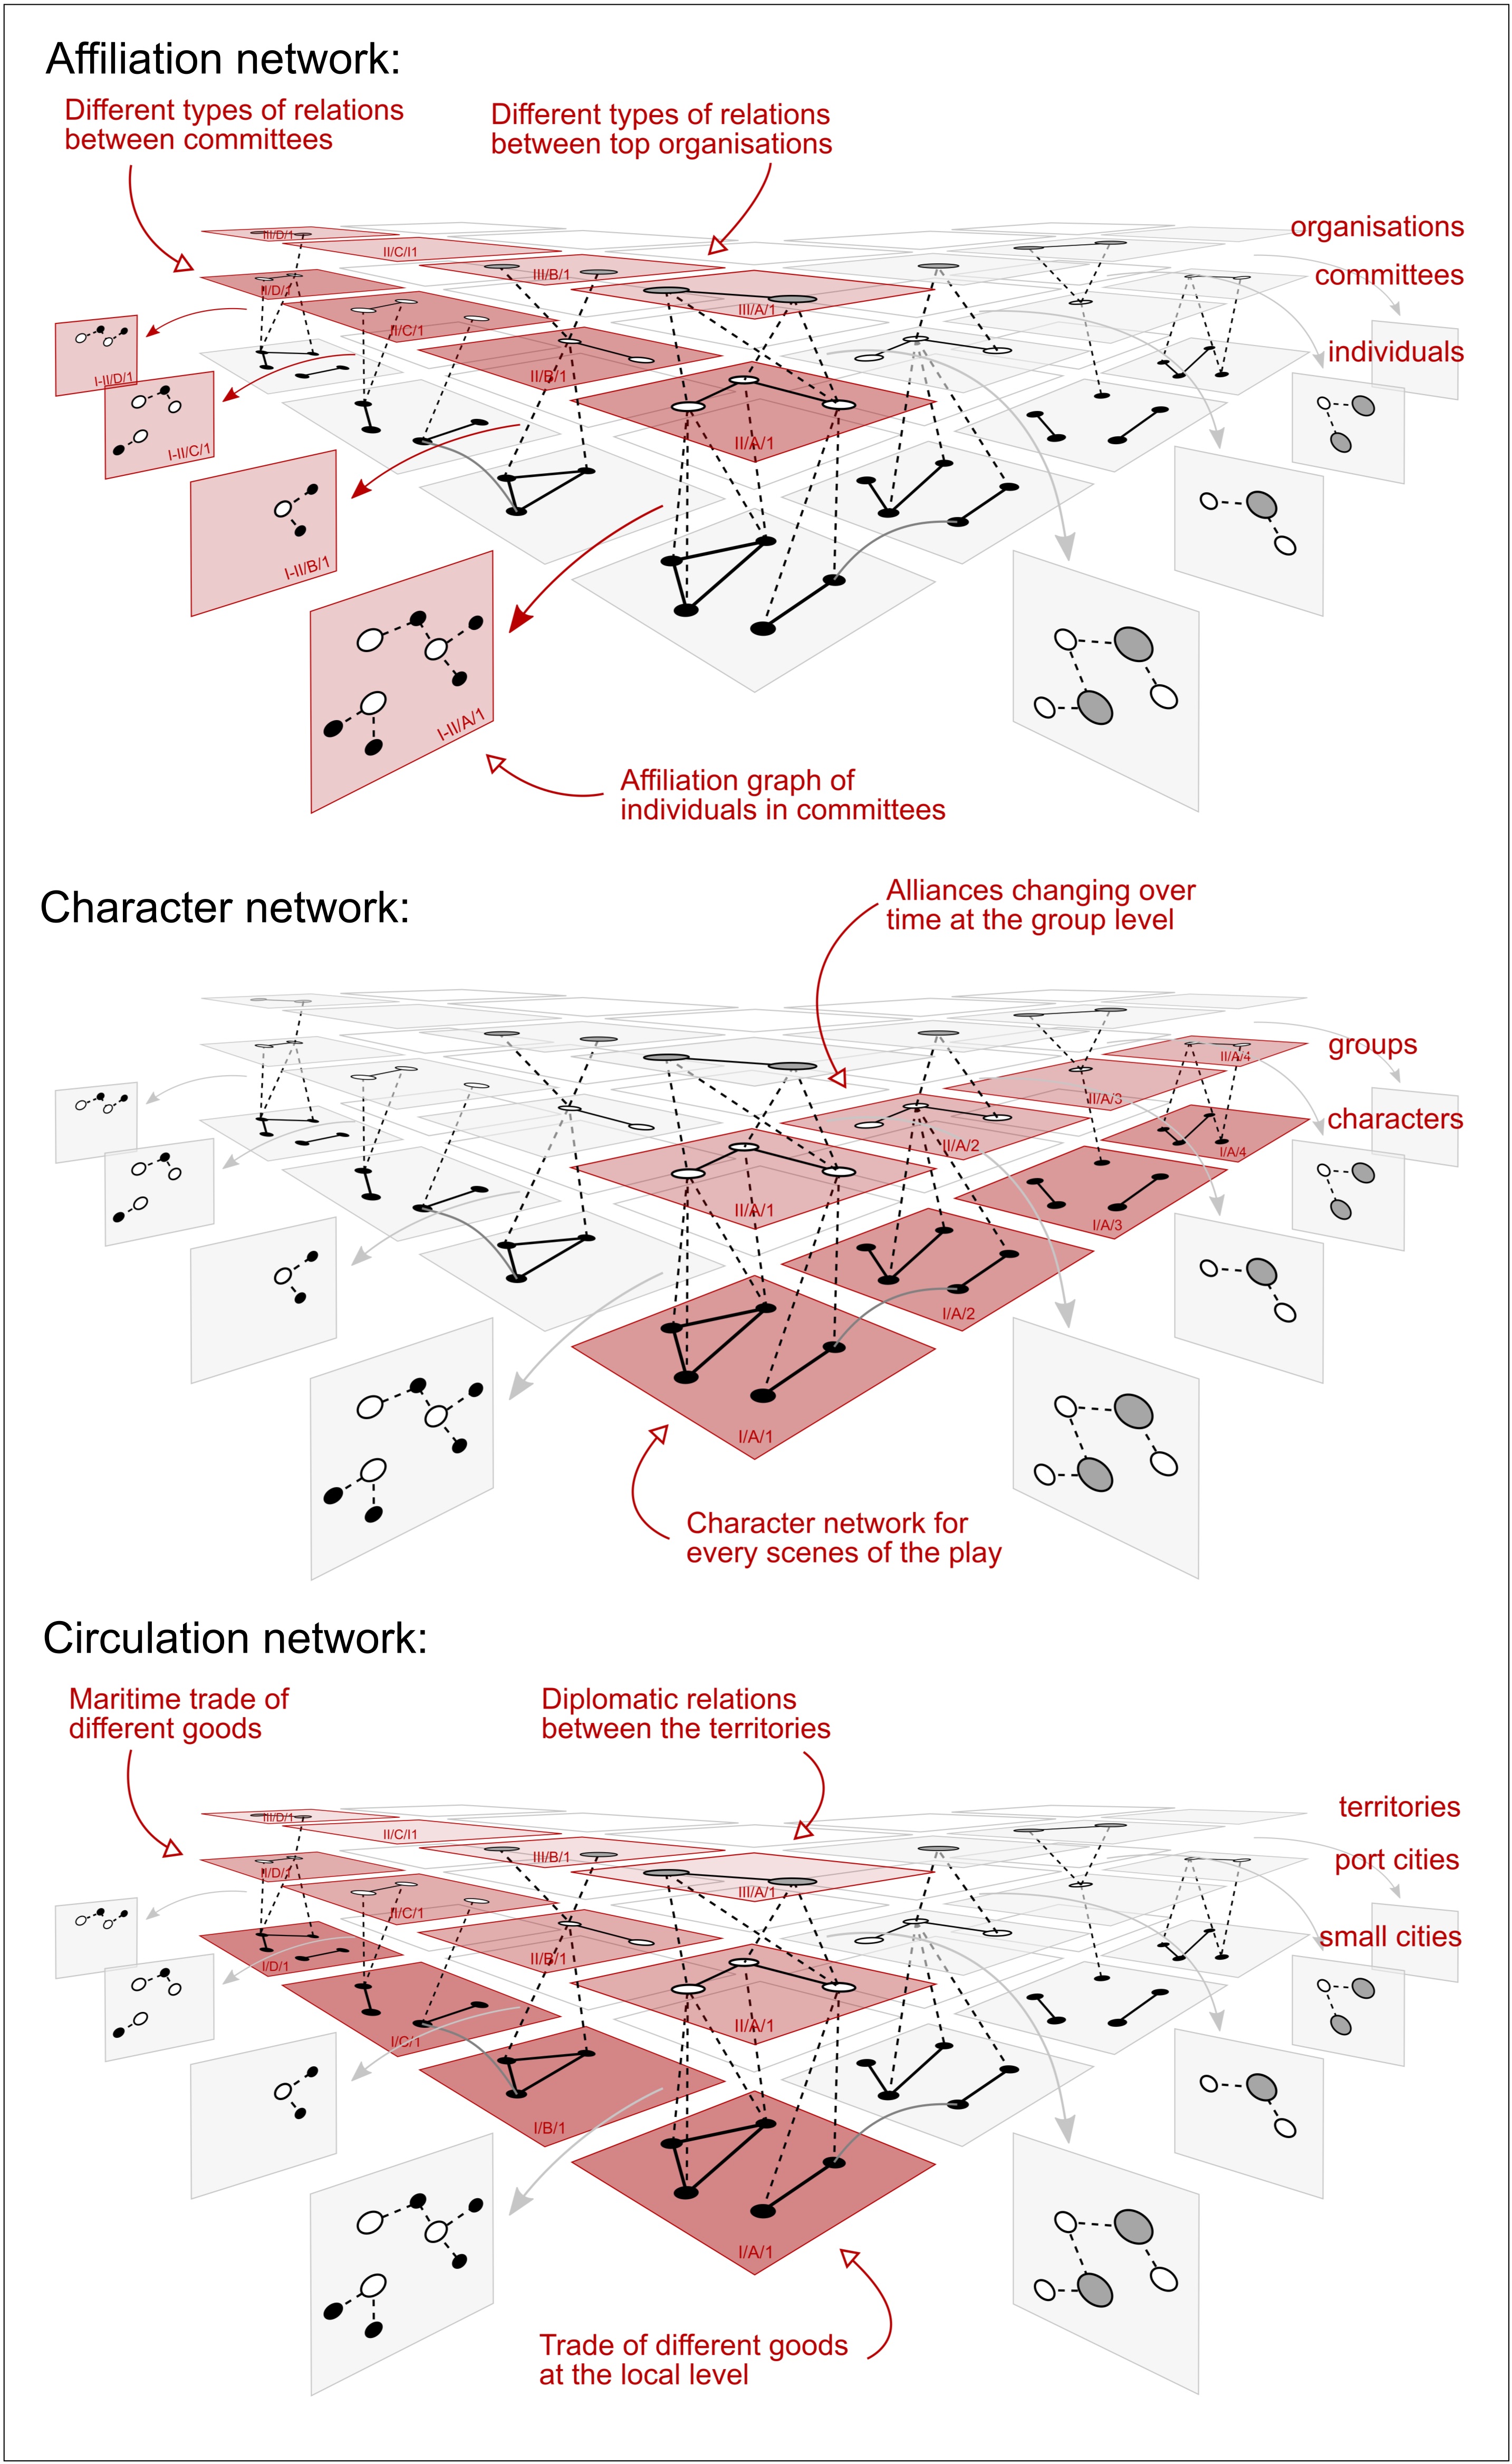
Figure 2: Modeling example of an affiliation network (1), a character network (2) and a circulation network (3).
References
Bach, B., Dragicevic, P., Archambault, D., Hurter, C., & Carpendale, S. (2014). A Review of Temporal Data Visualizations Based on Space-Time Cube Operations. In Eurographics Conference on Visualization, Swansea.
Conroy, M., Elo, K., Heyer, G., … Weingart, S. (2019). Visualizing Networks and Temporality. Network Visualization in the Humanities (Dagstuhl Reports), 8(11), 149–150.
David, T., & Westerhuis, G. (Eds.). (2014). The Power of Corporate Networks. A Comparative and Historical Perspective, New York: Routledge.
Düring, M., Eumann, U., Stark, M., & Keyserlingk, L. (Eds.). (2016). Handbuch Historische Netzwerkforschung: Grundlagen und Anwendungen, Berlin: LIT-Verlag.
Grandjean, M. (2017a). Analisi e visualizzazioni delle reti in storia. L’esempio della cooperazione intellettuale della Societa delle Nazioni. Memoria e Ricerca, 55(2), 371–393.
Grandjean, M. (2017b). Multimode and Multilevel: Vertical Dimension in Historical and Literary Networks. In Digital Humanities, Montreal.
Grandjean, M., & Jacomy, M. (2019). Translating Networks: Assessing Correspondence Between Network Visualisation and Analytics. In Digital Humanities 2019, Utrecht.
Kivelä, M., Arenas, A., Barthelemy, M., Gleeson, J. P., Moreno, Y., & Porter, M. A. (2014). Multilayer networks. Journal of Complex Networks, 2(3), 203–271.
Knudsen, S., Aerts, J., Archambault, D., … Von Landesberger, T. (2019). Unifying the Framework of Multi-Layer Network and Visual Analytics. Visual Analytics of Multilayer Networks Across Disciplines (Dagstuhl Reports), 9(2), 19–23.
Langmead, A., Otis, J. M., Warren, C. N., Weingart, S. B., & Zilinksi, L. D. (2016). Towards Interoperable Network Ontologies for the Digital Humanities. International Journal of Humanities and Arts Computing, 10(1), 22–35.
Lemercier, C. (2015). Taking time seriously. How do we deal with change in historical networks? In M. Gamper, L. Reschke, & M. Düring, eds., Knoten und Kanten III. Soziale Netzwerkanalyse in Geschichts- und Politikforschung, Bielefeld: Transcript Verlag, 183–211.
McGee, F., During, M., & Ghoniem, M. (2016). Towards Visual Analytics of Multilayer Graphs for Digital Cultural Heritage. In IEEE Viz Workshop “Visualization for the Digital Humanities.”
Orengo, H. A., & Livarda, A. (2016). The seeds of commerce: A network analysis-based approach to the Romano-British transport system. Journal of Archaeological Science, 66, 21–35.
Vugt, I. van. (2017). Using Multi-Layered Networks to Disclose Books in the Republic of Letters. Journal of Historical Network Research, 1(1), 25–51.
Xanthos, A., Pante, I., Rochat, Y., & Grandjean, M. (2016). Visualising the Dynamics of Character Networks. In Digital Humanities, Krakow, pp. 417–419.
Zhao, P., Li, X., Xin, D., & Han, J. (2011). Graph Cube: on Warehousing and OLAP Multidimensional Networks. In SIGMOD, Athens.